This project was commissioned to generate a Least Cost Path (LCP) for a proposed Light Rail Transit (LRT) route connecting a suburban origin to the downtown Halifax train station, using a multi-criteria impedance surface in ArcGIS Pro.
The case for new transit in Halifax is grounded in commuter wellbeing research: long, congested, car-dependent commutes are associated with reduced life satisfaction and elevated stress, while reliable rail service measurably reduces commute-related strain1. The route, in other words, isn't only about engineering — it's about who gets back twenty minutes of their day.
The cost surface was constructed from four criteria, each reclassified into impedance values and combined in the Raster Calculator:
- SlopeGenerated from the LiDAR DEM with the Slope tool, then reclassified — flatter terrain received lower cost, reflecting suitability for rail construction.
- Water bodiesEuclidean Distance rasters from lakes (polygon) and rivers (line) in the Nova Scotia Water dataset. Water itself was assigned the maximum impedance to prevent crossings.
- WetlandsSame approach — Euclidean Distance, reclassified to discourage construction near sensitive features.
- Commuter densityCOM_DRIVER + COM_PASS from Census Dissemination Areas, converted to raster via Feature to Raster. Denser commuter areas received lower cost, prioritizing demand.
The combined surface (Raster_TOTAL) ranged from 125 to 17,025. Cost Distance and Cost Path tools — with the suburban origin as source and downtown station as destination — produced the route, converted to a polyline via Raster to Polyline.
The original model treated LRT as if it would exist in isolation. But the literature on service-oriented transit makes a clear case that integration between modes — letting riders transfer easily between LRT and bus — drives ridership more than improvements to any single mode4. The Halifax Rapid Transit Strategy explicitly calls for corridor coordination2.
I added a fifth criterion: proximity to existing Halifax Transit bus routes, drawn from the HRM Open Data Portal3. Distance from the nearest bus route was reclassified into four bands:
- 0 – 200 mDesirable (impedance 25)
- 200 – 500 mGood (100)
- 500 – 1,000 mUndesirable (500)
- > 1,000 mHighly undesirable (2,000)
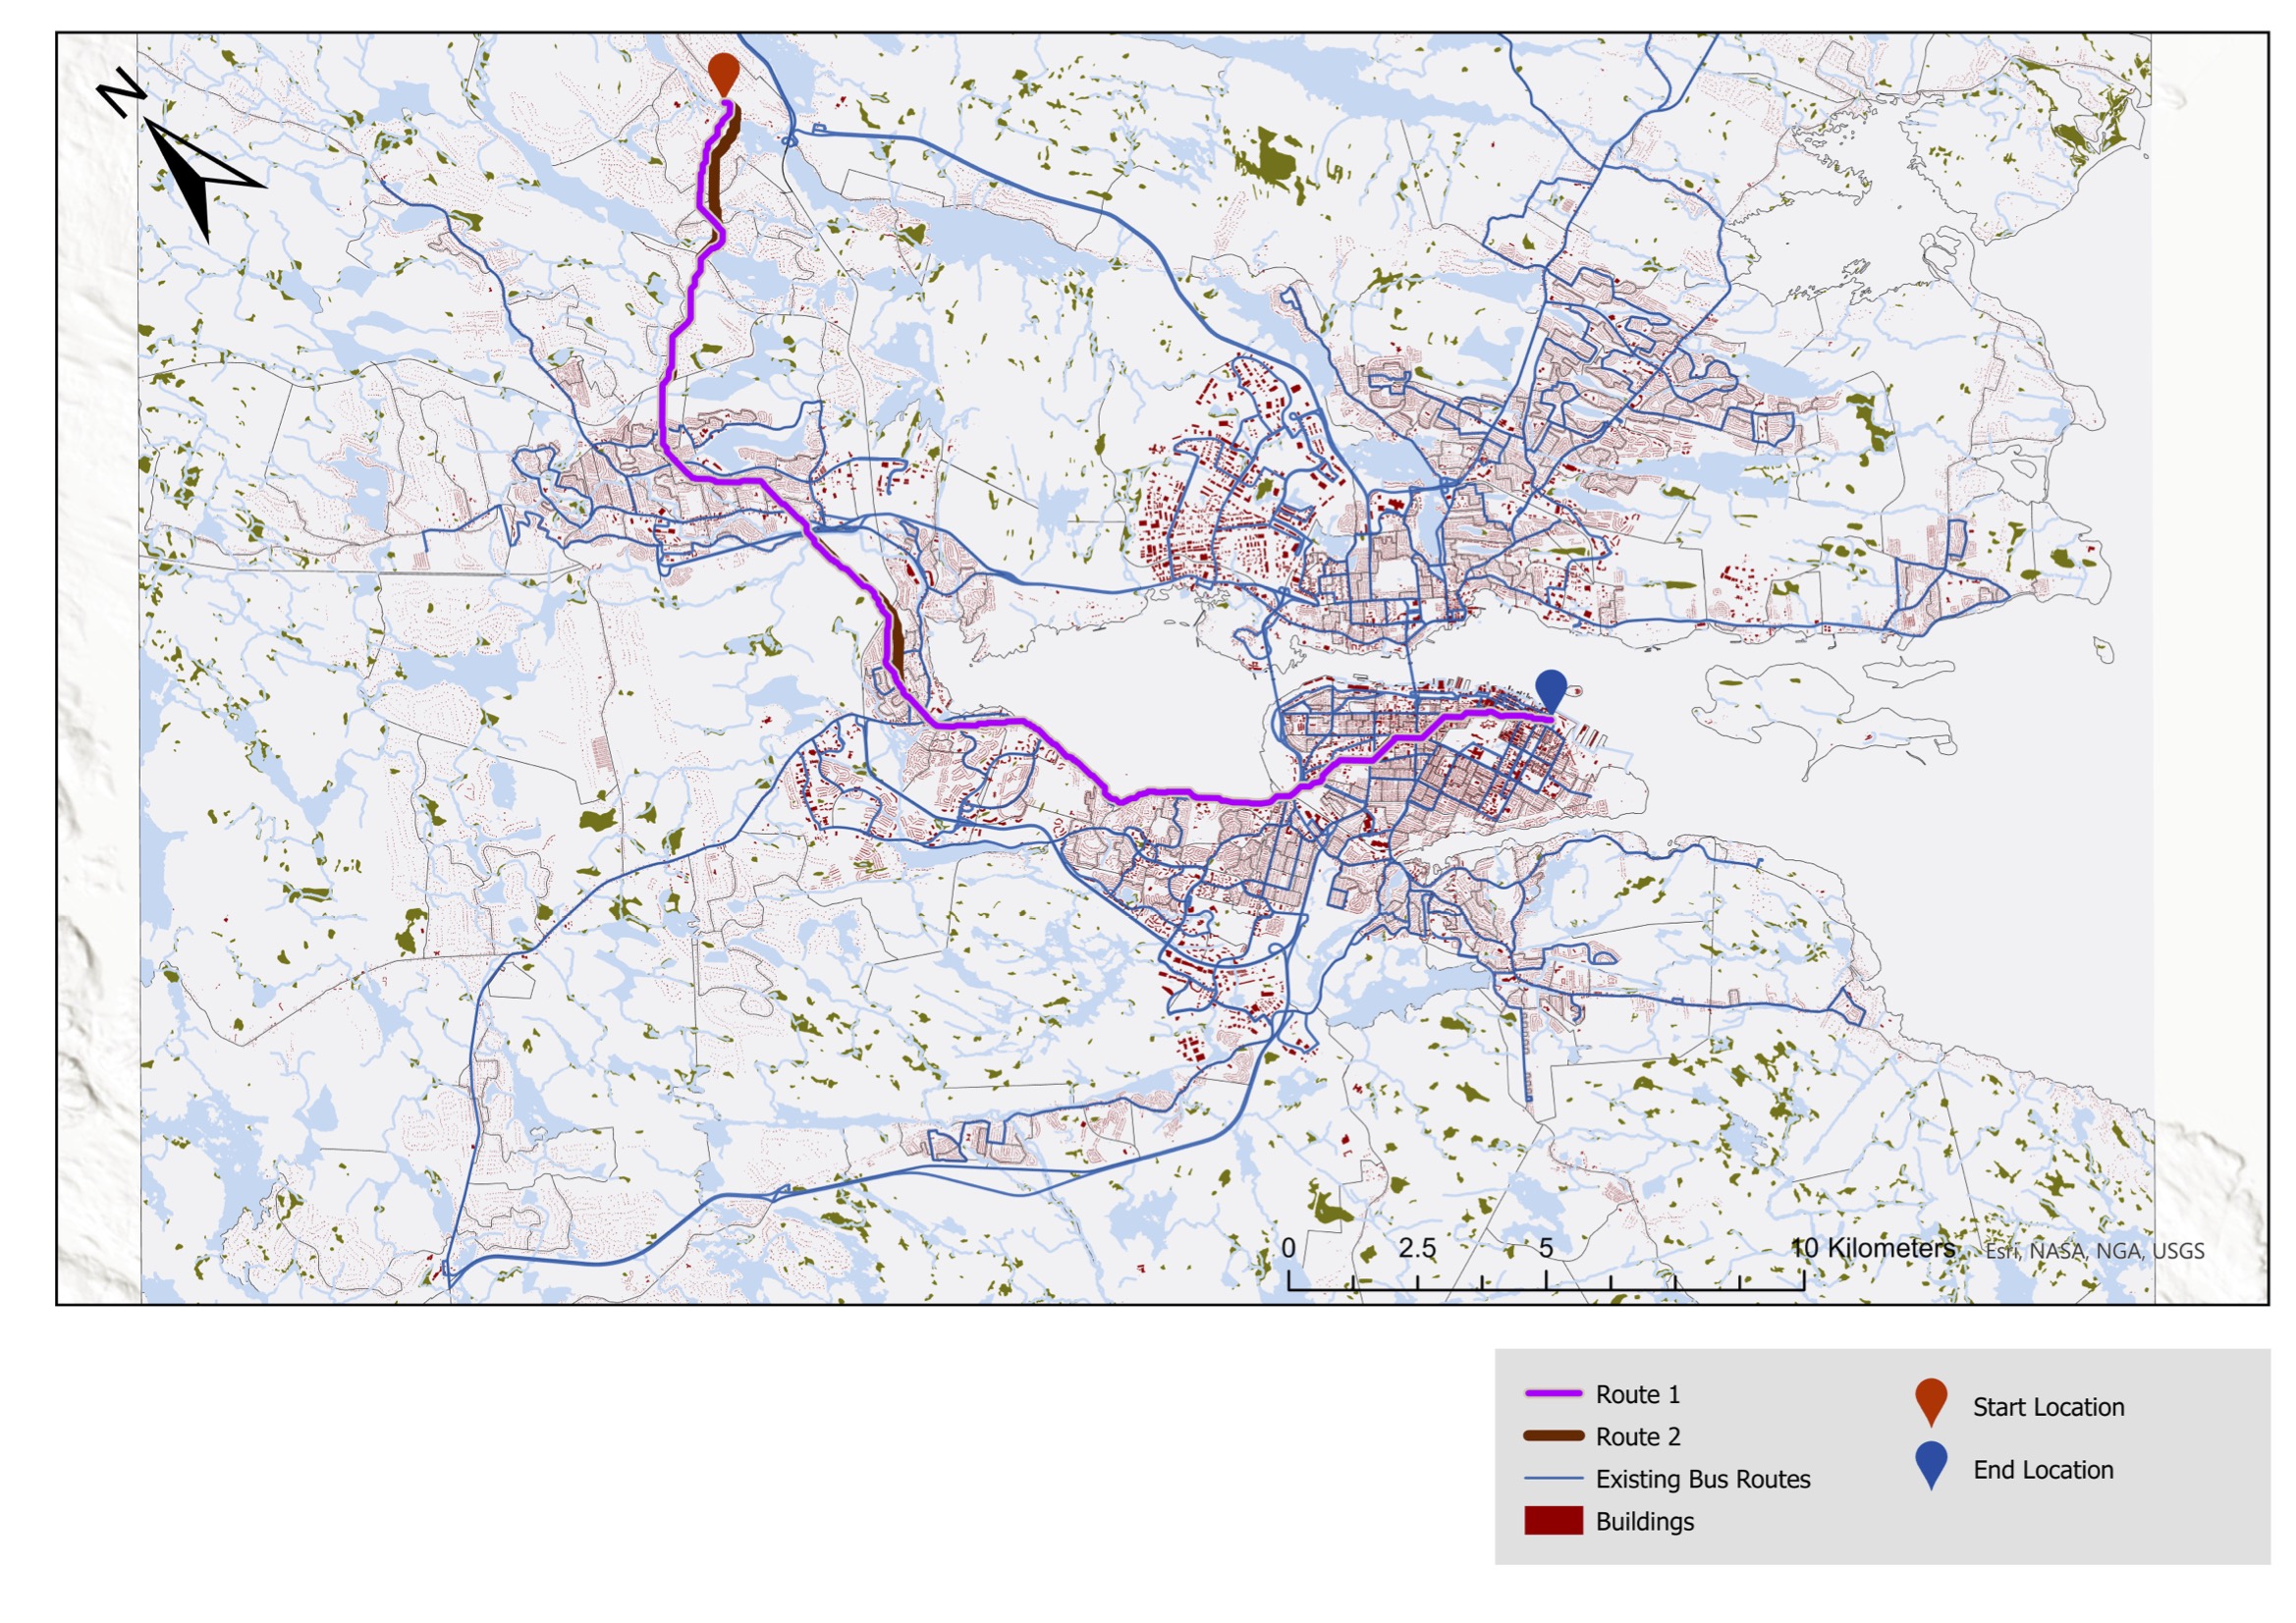
The Part 2 route differed only slightly from Part 1. Read shallowly, that's a null result: adding a fifth criterion didn't change the answer. Read more carefully, it's the conclusion.
Existing bus corridors already align with low-impedance terrain. The model and the bus network — produced by different processes, decades apart — arrived independently at the same answer. Either Halifax's bus planners already understood the terrain the model is now describing, or the city's geography is constraining enough that any rational network would converge on the same corridor.
For the proposal, that means Route 2 is the recommended alignment: not because it's substantially different, but because it makes the multimodal integration argument visible.
Three honest caveats. First, all criteria were equally weighted. In transit planning practice, hard constraints (water, slope) should likely outrank soft signals (commuter density), and the equal-weight surface flattens that hierarchy.
Second, the model excludes land use, expropriation cost, and environmental review beyond water bodies and wetlands — all of which determine whether a proposed alignment is actually buildable.
Third, both routes are corridors, not station plans. A real LRT proposal would require station-spacing analysis as a separate layer — placed where the corridor passes through ridership generators, not at evenly spaced intervals along the line.